The Fort Worth Press - A history of $100 crude oil

USD -
AED 3.672902
AFN 67.93001
ALL 93.193946
AMD 386.923413
ANG 1.801781
AOA 912.999896
ARS 998.7463
AUD 1.544926
AWG 1.8025
AZN 1.708683
BAM 1.857034
BBD 2.018544
BDT 119.466191
BGN 1.8528
BHD 0.37691
BIF 2951.893591
BMD 1
BND 1.345309
BOB 6.907618
BRL 5.794289
BSD 0.999734
BTN 84.379973
BWP 13.7232
BYN 3.271695
BYR 19600
BZD 2.015126
CAD 1.40439
CDF 2865.999676
CHF 0.887235
CLF 0.035356
CLP 975.579869
CNY 7.227102
CNH 7.23326
COP 4481.75
CRC 510.622137
CUC 1
CUP 26.5
CVE 104.696706
CZK 23.9117
DJF 178.02275
DKK 7.05284
DOP 60.463063
DZD 133.480976
EGP 49.353683
ERN 15
ETB 123.922406
EUR 0.945605
FJD 2.27485
FKP 0.789317
GBP 0.78925
GEL 2.724997
GGP 0.789317
GHS 16.070301
GIP 0.789317
GMD 71.000057
GNF 8615.901679
GTQ 7.720428
GYD 209.156036
HKD 7.784805
HNL 25.243548
HRK 7.133259
HTG 131.35034
HUF 383.549468
IDR 15915.55
ILS 3.74217
IMP 0.789317
INR 84.43015
IQD 1309.646453
IRR 42104.999924
ISK 137.769996
JEP 0.789317
JMD 158.263545
JOD 0.709101
JPY 155.584502
KES 129.496546
KGS 86.376503
KHR 4060.610088
KMF 466.502308
KPW 899.999621
KRW 1394.729926
KWD 0.30754
KYD 0.833092
KZT 495.639418
LAK 21961.953503
LBP 89524.727375
LKR 292.075941
LRD 184.450901
LSL 18.299159
LTL 2.95274
LVL 0.60489
LYD 4.883306
MAD 9.985045
MDL 18.109829
MGA 4683.909683
MKD 58.366883
MMK 3247.960992
MNT 3397.999946
MOP 8.014356
MRU 39.742695
MUR 47.100648
MVR 15.460444
MWK 1733.51184
MXN 20.38225
MYR 4.467988
MZN 63.849629
NAD 18.299159
NGN 1670.41031
NIO 36.789837
NOK 11.11367
NPR 135.008261
NZD 1.70258
OMR 0.385009
PAB 0.999729
PEN 3.809397
PGK 3.960922
PHP 58.67949
PKR 277.672857
PLN 4.08525
PYG 7807.745078
QAR 3.644486
RON 4.705604
RSD 110.621968
RUB 100.048601
RWF 1372.604873
SAR 3.755749
SBD 8.383384
SCR 13.747759
SDG 601.49913
SEK 10.965515
SGD 1.34141
SHP 0.789317
SLE 22.700677
SLL 20969.504736
SOS 571.317344
SRD 35.356503
STD 20697.981008
SVC 8.747751
SYP 2512.529858
SZL 18.306462
THB 34.792981
TJS 10.657058
TMT 3.5
TND 3.157485
TOP 2.342098
TRY 34.422103
TTD 6.787981
TWD 32.470003
TZS 2659.99992
UAH 41.213563
UGX 3668.871091
UYU 42.471372
UZS 12804.018287
VES 45.480156
VND 25392.5
VUV 118.722009
WST 2.791591
XAF 622.834653
XAG 0.032892
XAU 0.00039
XCD 2.70255
XDR 0.753148
XOF 622.834653
XPF 113.237465
YER 249.850085
ZAR 18.18025
ZMK 9001.202782
ZMW 27.416836
ZWL 321.999592
  • CMSD

    -0.0050

    24.725

    -0.02%

  • SCS

    -0.1000

    13.27

    -0.75%

  • BP

    0.4800

    29.05

    +1.65%

  • GSK

    -0.7200

    34.39

    -2.09%

  • JRI

    -0.0300

    13.21

    -0.23%

  • CMSC

    -0.0600

    24.55

    -0.24%

  • RBGPF

    61.8400

    61.84

    +100%

  • BCC

    -2.2000

    140.35

    -1.57%

  • BTI

    0.0700

    35.49

    +0.2%

  • NGG

    0.2500

    62.37

    +0.4%

  • RIO

    -0.1900

    60.43

    -0.31%

  • RYCEF

    -0.3200

    6.79

    -4.71%

  • BCE

    -0.3700

    26.84

    -1.38%

  • AZN

    -0.2500

    65.04

    -0.38%

  • VOD

    -0.0700

    8.68

    -0.81%

  • RELX

    -0.1700

    45.95

    -0.37%

A history of $100 crude oil

A history of $100 crude oil

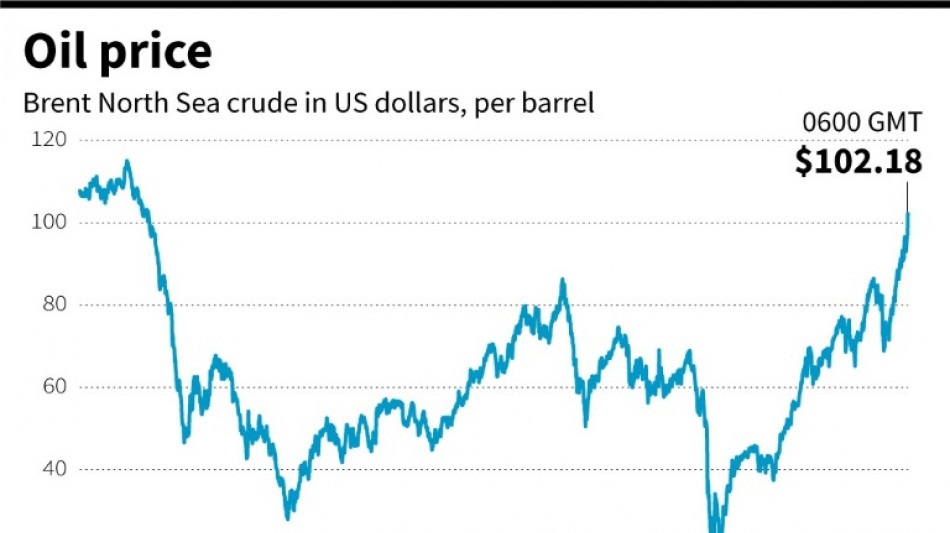
World oil prices on Thursday breached $100 for the first time in more than seven years, this time on supply fears after major producer Russia attacked Ukraine.

Text size:

European benchmark Brent North Sea crude surged more than eight percent to $105.79 per barrel -- the highest level since 2014.

US contract West Texas Intermediate reached $100.54 per barrel, also a peak last seen more than seven years ago.

That capped a meteoric rise over almost two years since crude fell into negative territory for the first time.

In early 2020, oil briefly turned negative following the onset of the coronavirus pandemic that shut offices and factories -- and grounded planes worldwide.

The market tumbled also on scarce storage facilities and a Saudi-Russia price war.

WTI slumped to minus $40.32, meaning that producers paid buyers to take the oil off their hands.

At the same time, Brent tanked to a record low $15.98.

Oil prices have since recovered, rocketing last year to around $70 per barrel as economies reopened from lockdowns, sparking a surge in demand for crude.

Russia is a key member of the expanded OPEC+ producers' grouping that also includes number one player Saudi Arabia.

Here is a timeline of when oil previously topped $100.

- 2012: Iran crude embargo -

Oil started the year above $100 after Western powers imposed a raft of economic sanctions on Iran, including crude exports, aimed at halting its controversial nuclear programme.

- 2011: Arab Spring -

Brent soared to $127 in March 2011 following unrest in the oil-producing Middle East and North Africa region.

The market bounded higher after the so-called Arab Spring uprisings toppled the long-standing leaders of Tunisia, Egypt and Yemen, while unrest also rocked other parts of the region, especially crude producer Libya.

- 2008: Record-high $147 -

On July 11, 2008, Brent hit a record high of $147.50 per barrel, having breached $100 at the start of the year for the first time.

The same day, WTI achieved an all-time peak at $147.27 per barrel.

Crude surged thanks to falling stockpiles in the United States, strong Chinese demand and unrest in key OPEC members Iran and Nigeria.

A weaker dollar also lent strong support, making crude, priced in the currency, cheaper for buyers holding other currencies.

But by December 2008, Brent had tanked to sit at around $36 owing to a severe economic recession worldwide in the wake of the global financial crisis.

burs-em-bcp/rfj/rl

H.M.Hernandez--TFWP